One-liner
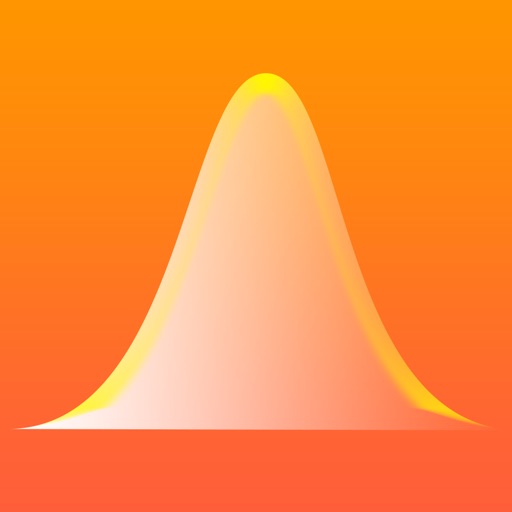
A focused, intuitive graphing calculator for visualizing and calculating probabilities in the normal distribution.
Strengths
- Clean, minimal interface optimized for quick normal distribution calculations
- Accurate real-time graphing of PDF and CDF functions with interactive sliders
- Supports z-score, probability, and inverse probability calculations
- Highly rated for precision and usability (5.0/5 from one review)
- Strong keyword ranking for 'normal' (#39) indicates demand
Weaknesses
- Only 1 review limits confidence in user feedback quality
- No mention of advanced features like multiple distributions or statistical inference tools
- Lacks export/share functionality for graphs (common in similar apps)
- No dark mode or accessibility options mentioned in metadata
- No support for custom mean/std deviation inputs beyond basic use cases
Opportunities
- Add support for other distributions (t, chi-square, binomial) to expand utility
- Introduce a 'teach mode' with step-by-step walkthroughs for students
- Enable graph export to image or PDF for sharing with teachers or notes
- Build a companion web app or calculator for cross-device access
- Target educators by adding classroom-ready templates or quiz modes
Competitors
- Statistics Calculator
- Normal Distribution Calculator
- Desmos Graphing Calculator
Generated by NVIDIA NIM llama-3.3-70b · 5/12/2026, 9:55:53 AM